
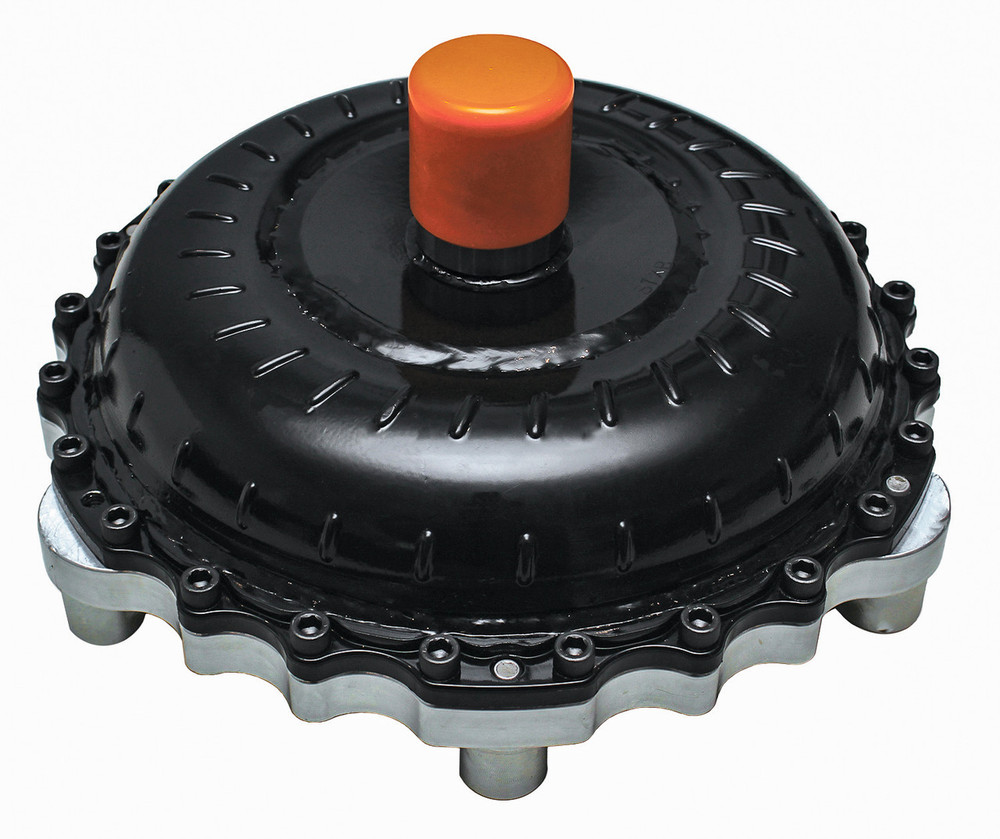
Optimizing Performance Data: Dyno Strategies for Non-Lockup Converters
Accurate performance data is the cornerstone of effective decision-making, whether you’re a small tuning shop or a large automotive R&D division. When dealing with vehicles equipped with non-lockup torque converters, the inherent slip introduces a unique set of challenges that can skew results and lead to costly, misinformed strategic choices. This guide provides a framework for conducting dyno tests that yield reliable data, ensuring your investments in tuning and modifications deliver measurable ROI and mitigate unnecessary risks.
The Strategic Imperative: Why Non-Lockup Dyno Data Requires Precision
For any performance project, investment in dyno testing is justified by the need for empirical data to validate modifications, compare component effectiveness, and optimize calibration. However, the non-lockup torque converter, by design, allows for a degree of slip between the engine and the drivetrain, which fundamentally impacts how power is transferred and measured on a dynamometer. This slip means that the power observed at the wheels is not a direct, linear reflection of the engine’s output in the same way it would be with a direct-drive manual transmission or a locked converter.
Failing to account for this variable can lead to significant strategic missteps. Imagine investing in a new turbocharger or cam profile based on dyno numbers that are artificially low or inconsistently measured due to uncontrolled converter slip. This not only wastes capital on potentially suboptimal parts but also misdirects tuning efforts, extending development cycles and increasing labor costs. From a business impact perspective, this translates into lost revenue from delayed product launches, reduced competitive advantage, and damaged customer confidence. Therefore, understanding and mitigating the unique challenges of non-lockup dyno testing isn’t just about technical accuracy; it’s about safeguarding your R&D budget, streamlining your development process, and ensuring that every modification yields its maximum potential return on investment. The risk of making sub-optimal design or tuning decisions based on flawed data far outweighs the perceived time-saving of an unoptimized dyno procedure.
Operational Excellence: Pre-Dyno Setup and Execution for Data Integrity
Achieving reliable dyno results with a non-lockup converter begins long before the wheels spin. Strategic preparation and meticulous execution are paramount to ensure data integrity, thereby protecting your investment and enabling robust decision-making. This involves a comprehensive approach covering vehicle readiness, dyno configuration, and a standardized testing protocol that minimizes variables and maximizes repeatability. For small-scale operations, this translates into efficient use of expensive dyno time, while for larger enterprises, it ensures consistency across multiple test cells and projects.

Key preparatory steps include a thorough vehicle inspection to confirm all systems are operating optimally, from ignition to fuel delivery. The transmission fluid level and condition are critically important; contaminated or low fluid exacerbates slip and generates excessive heat, compromising both data and component longevity. Tire pressure and condition should be uniform and appropriate for dyno loads. Selecting the correct gear for the dyno pull is crucial; typically, a gear that achieves a 1:1 drive ratio (or closest to it) is preferred to minimize drivetrain losses and torque multiplication variables, ensuring the converter operates in a consistent slip range. Beyond the vehicle, dyno settings must be carefully calibrated. This includes selecting the appropriate load settings, ensuring accurate speed and torque measurement, and setting up comprehensive data logging for all relevant parameters: engine RPM, wheel speed, transmission temperature, converter slip percentage (if available), boost pressure, air/fuel ratio, and exhaust gas temperature.
During the run itself, consistency is king. Implement a standardized warm-up procedure to bring all fluids and components to their operating temperatures before any measurement pulls. Perform multiple, consecutive pulls under identical conditions, allowing for cool-down periods if necessary to maintain consistent transmission fluid temperatures. This repeatability check is vital for identifying anomalies and validating the consistency of your data. The goal is not just to get a number, but to obtain a range of consistent numbers that can be confidently used for strategic analysis and informed decision-making. By investing time in these operational excellences, you mitigate the risk of generating misleading data and enhance the benefit of every dyno session.
Translating Data into Action: ROI-Driven Analysis and Decision-Making
Once the dyno runs are complete, the real strategic work begins: interpreting the collected data to make informed decisions that drive tangible ROI. Raw power and torque figures, especially from non-lockup setups, are only part of the story. The critical step involves analyzing these figures in context, particularly by understanding and accounting for torque converter slip. Advanced data logging, including input and output shaft speeds of the transmission, allows for the calculation of slip percentage, providing a clearer picture of how much engine power is actually reaching the wheels versus being absorbed by the converter. This distinction is crucial for accurately assessing engine performance and the efficiency of the drivetrain.
When reviewing dyno graphs, look beyond peak numbers. Examine the power and torque curves across the entire RPM range. A non-lockup converter often results in a more ‘smoothed out’ curve due to slip, especially at lower RPMs. The focus should be on consistency between runs and the overall shape of the curve, comparing it against previous baselines or target performance profiles. If available, using dyno correction factors (e.g., SAE J1349) is essential to standardize results across different atmospheric conditions, allowing for accurate year-over-year comparisons or comparisons against industry benchmarks. The benefit here is clear: decisions about camshaft profiles, turbocharger sizing, or transmission tuning can be made with confidence, knowing the data reflects actual performance gains, not just measurement anomalies. The risk of misinterpreting data is that you might spend capital on upgrades that don’t deliver the expected performance, or worse, negatively impact other aspects of the vehicle’s operation.
From a decision-making framework, use the validated dyno data to create a clear cost-benefit analysis for any proposed modification. For instance, if a component upgrade shows a marginal increase in peak power but significantly compromises driveability or transmission longevity due to increased heat, the ROI might be negative. Conversely, a modification that shows a modest peak gain but a substantial increase in average power across the usable RPM band, coupled with stable transmission temperatures, presents a strong business case. This approach, grounded in robust data analysis, allows both small-scale tuners and large R&D teams to prioritize investments that offer the greatest impact and minimize financial exposure, ensuring every performance decision is strategically sound and maximizes the value generated.
- Optimize Torque Converter Selection: Choose a converter with a stall speed appropriate for the engine’s power band and intended use to minimize excessive slip during dyno pulls.
- Implement Robust Cooling: Utilize external transmission coolers and fans directed at the transmission during testing to maintain stable fluid temperatures, reducing slip variation and component wear.
- Select the Correct Dyno Gear: Aim for a transmission gear ratio that is as close to 1:1 as possible (or the gear recommended by the dyno manufacturer) to minimize torque multiplication and drivetrain losses, ensuring consistent slip characteristics.
- Consistent Roll-on Strategy: Standardize the starting RPM and acceleration rate for each pull. This consistency helps to ensure the torque converter behaves predictably across multiple runs.
- Comprehensive Data Logging: Log engine RPM, output shaft speed (if possible), transmission fluid temperature, and vehicle speed. This allows for post-analysis calculation of converter slip and thermal management assessment.
- Use Load-Bearing Dynos: Inertia-only dynos can be less forgiving. Load-bearing dynamometers allow for more controlled pulls, simulating real-world driving conditions more effectively and managing slip.
Common Mistakes to Avoid
- Ignoring Transmission Fluid Temperature: Overheating fluid causes excessive slip, inconsistent results, and accelerated component wear. Always monitor and manage transmission temperatures.
- Inconsistent Dyno Procedures: Varying warm-up times, gear selections, or throttle application will lead to non-comparable data, wasting valuable dyno time and resources.
- Failing to Account for Slip: Directly comparing raw wheel horsepower numbers from a non-lockup setup to a locked setup without considering slip will lead to inaccurate conclusions and poor decision-making.
- Insufficient Data Logging: Not logging enough parameters means you can’t properly diagnose issues or understand the full behavior of the converter and transmission during the run.
- Over-reliance on Peak Numbers: Focusing solely on peak horsepower and torque without evaluating the entire power band or the consistency across multiple runs can be misleading for real-world performance.
- Neglecting Drivetrain Maintenance: Testing a vehicle with worn U-joints, axles, or improper fluid levels will yield inconsistent and unreliable data.
FAQ
How does torque converter slip impact dyno results, and how can it be accounted for?
Torque converter slip causes a discrepancy between engine RPM and transmission input shaft speed (and thus wheel speed), meaning less power is directly transferred to the wheels than the engine is producing. This typically results in lower, more ’rounded’ power and torque curves compared to a direct-drive system. To account for it, comprehensive data logging is essential, including engine RPM and an accurate measure of transmission output shaft speed or wheel speed. By comparing these, you can calculate slip percentage. Some advanced dyno software can apply correction factors or allow for more sophisticated analysis to estimate engine power more accurately, though this always involves a degree of estimation. The goal is to understand the extent of slip to contextualize the wheel horsepower data for better decision-making.
What are the key cooling considerations when dyno testing non-lockup converters for extended periods?
Cooling is paramount for non-lockup converter dyno testing due to the heat generated by friction during slip. Key considerations include ensuring the vehicle’s auxiliary transmission cooler (if present) is fully functional and perhaps adding external cooling fans directly targeting the transmission pan and cooler lines. Monitoring transmission fluid temperature constantly is critical; if temperatures rise excessively (typically above 220-230°F or 104-110°C), cool-down periods must be implemented between runs to prevent fluid degradation and component damage. In some cases, specialized high-performance transmission fluids or larger capacity external coolers might be necessary for sustained high-load testing, directly impacting test consistency and component longevity (ROI).
Is it possible to accurately compare dyno results from non-lockup setups to lock-up setups?
Direct, raw wheel horsepower comparisons between non-lockup and lock-up setups can be misleading due to the inherent slip of the non-lockup converter, which typically shows lower wheel horsepower for the same engine output. A more accurate comparison requires understanding and accounting for this slip. Ideally, if you have engine dynamometer data or can calculate engine power more precisely by integrating slip data, then a comparison becomes more meaningful. Otherwise, focus on the percentage change in power within the non-lockup setup after modifications, or compare the ‘area under the curve’ rather than just peak numbers. The strategic decision should be based on the overall performance envelope and efficiency of the non-lockup system in its intended application, rather than a superficial comparison of absolute peak numbers against a fundamentally different drivetrain setup.